U.S. Wireless CapEx – It’s looking up!
The wireless equipment industry took a hit in the second half of 2014 when AT&T Mobility abruptly scaled back in its capital expenditures (capex). The company explained that it had invested ahead of budget in the first half of the year, and that its 4G LTE build out was nearing completion, so it did not need a sustained level of investment for the balance of the year.
The cutback had an immediate, wide-ranging impact. Equipment orders were deferred or canceled. Lay-offs occurred up and down the supply chain.
Even in early 2015, the effects of AT&T’s cutback are still being felt. The question is: Will overall network investments remain sluggish throughout the year, or will they pick up again and when?
Our analysis suggests that after a slow start, wireless capex will increase in Q2 2015. Based on the carriers’ current guidance for full-year 2015e, aggregate capex will come in at $31.8 billion, slightly below the peak level of $32.2 billion reached in 2014.
Capex is one of the most-watched financial metrics in telecom. It is the key indicator of investment that wireless carriers make to expand their network capacity and coverage, both outdoors and indoors, to meet the demand for voice, data and video services in an increasingly anywhere, anytime, any media environment that we all have come to expect.
Two main factors drive wireless network expansion: the number of devices on the air, and the amount of mobile data traffic that each device generates. Independent forecasts indicate dramatic growth in both of these drivers over the next several years.
Capex funds the procurement of wireless network equipment and services that are delivered by hundreds of manufacturers, distributors, contractors and systems integrators. Capex buys base station radios, antennas, cables, mounting hardware, power, grounding, cabinets/shelters, towers, backhaul, core switching systems, DAS, small cells as well as capitalized engineering and installation. As long as capex holds up, equipment orders are strong and many people are employed in making, delivering, installing and maintaining the network. However, when capex slows down, or is interrupted abruptly as happened in the second half of 2014, then equipment orders stall and people lose their jobs.
Big Picture Network Investments
Aggregate annual capex in the U.S. tallies spending among the Big 4 national carriers (AT&T Mobility, Verizon Wireless Sprint, T-Mobile US) and dozens of smaller regional cellular carriers such as US Cellular, C Spire, nTelos, Cincinnati Bell Wireless, Bluegrass Cellular, Cellular One, SouthernLINC Wireless, and others.
Exhibit 1 shows that total U.S. carrier capex reached a record level $32.2 billion in 2014, up from $22.9 billion in 2010, a compound average growth rate (CAGR) of 9% per annum.
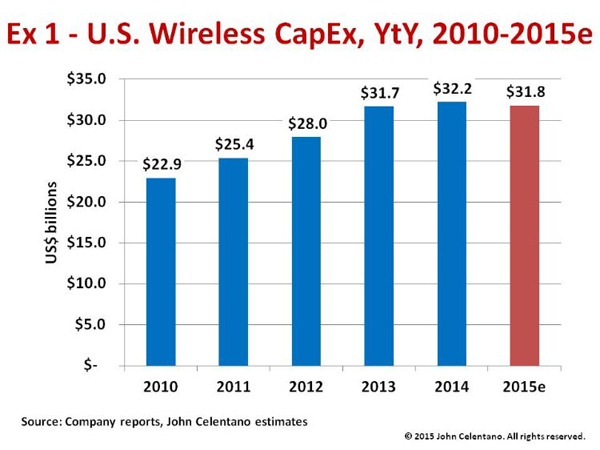
The Big 4 account for 95% of the total U.S. wireless capex. AT&T Mobility and Version Wireless together account for nearly 70% of the total. Collectively, the regional carrier capex is over $1 billion a year.
The proliferation of smartphones and tablets and the corresponding expansion of network capacity in 3G EDGE/HSPA+ air interfaces in PCS 850/1900 MHz bands grew at double-digit rates between 2010 and 2012. 3G expansion along with new 4G LTE builds in new frequency bands, namely 700 MHz and AWS (1700/2100 MHz), drove aggregate spending in 2013 to $31.7 billion, a jump 14% from the $28.0 billion in 2012. These figures include macrocell construction and upgrades along with new distributed antenna system (DAS) and small cell deployments.
2014 capex grew only 1% over the prior year but still hit a record high of $32.2 billion. By Q3 2014, however, new network construction slowed significantly as 4G LTE build-outs neared completion, and AT&T Mobility throttled back on its new network investments.
Based on the various companies’ guidance for 2015e, we estimate that aggregate capex will tally $31.8 billion, down just -1%compared to 2014 levels. That is the good news because it means that overall network investment remains at close to the all-time high.
The decline is due mainly to cutbacks at AT&T Mobility which is reducing its 2015e wireless capex by -13% to $9.9 billion compared to $11.4 billion in 2014. This is the first year since 2011 that AT&T’s annual wireless capex will drop below $10.0 billion as the company is nearing completion of its 4G LTE build-out, and is scaling back on both its carrier-led DAS projects and planned small cell deployments.
Sprint’s 2015e capex is expected to grow to $6.0 billion, up +10% from $5.4 billion as the company continues apace to optimize CDMA and 4G LTE in 1900 MHz and 2.5 GHz bands, and 4G LTE at 800 MHz.
T-Mobile US’s capex increase is primarily for its modernization program and integration of MetroPCS as well as commencing the rollout of 4G LTE on the 700 MHz A-Block and 1900 MHz PCS spectrum. The company expects to continue its network upgrade program in 2015e with a +5% increase in capex to about $4.6 billion.
Verizon Wireless is maintaining its network investment as 4G LTE devices become a growing portion of its customer base. Its 2015e capex is projected to grow +2% to roughly $10.8 billion.
US Cellular, the largest of the regional cellular carriers, will increase its 2015e network capex to $600 million, up +8% from $558 million in 2014. The company is striving to maintain network quality as its subscriber base expands, smartphone adoption becomes prevalent and mobile data drives new revenues.
Quarter-to-Quarter Capex Tracking
While the full-year capex guidance is an important indicator for suppliers to monitor, it’s the level of quarter-to-quarter (QtQ) spending that is much more difficult to anticipate.
Historically, capital spending starts slow in Q1 as budgets for the new year ramp up and outside construction generally is slowed by winter weather around much of the country. Q2 spending rates usually increase as the weather improves and construction activity picks up. Q3 spending tends to levels out or even dip with the summer slowdown. However, Q4 capex upticks, sometimes substantially, as carriers push to complete their planned network upgrades and expansions, and to meet their budget goals for the year.
Exhibit 2 shows that 2014 quarterly spending among the Big 4 carriers was anything but typical.
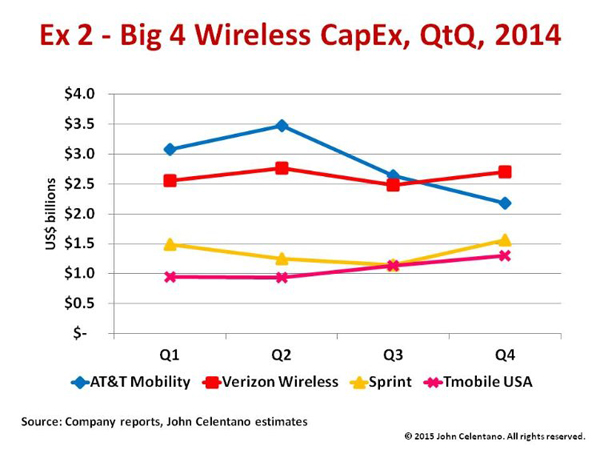
AT&T Mobility was the whole story. The company started the year at a high level and increased that already high level through Q2. By mid-year, the company burned through nearly 60% of its 2014 budget, then hit the brakes on spending through both Q3 and Q4. With AT&T Mobility alone accounting for 35% of the U.S. aggregate spending, such sharp reductions reverberated across the entire supply chain and set the tone for the balance of 2014 that is still being felt in early 2015.
By contrast, Verizon Wireless’ capex albeit at a lower level than AT&T’s averaged $2.5 billion a quarter, and exhibited more of a historical QtQ spending pattern.
For most of 2014, Sprint’s QtQ capex was atypical as the company was making investment adjustments under new management and a new financial reporting structure. By Q4, Sprint was back on track, however.
T-Mobile US’s QtQ spending, at a roughly $1 billion per quarter, increased steadily each quarter throughout the year.
Upbeat 2015e Spending Outlook
Exhibit 3 compares actual QtQ capex for 2012 through 2014 with projections for 2015e.
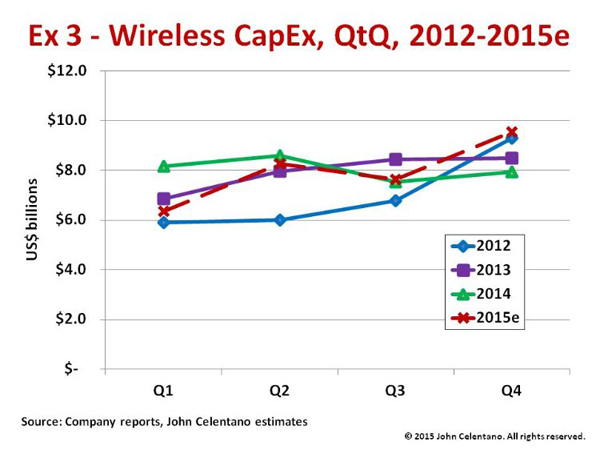
In 2012, capital spending grew steadily each quarter throughout the year as new smartphones came on stream.
Network investment continued strong in 2013 through Q3, then leveled out in Q4.
The AT&T effect was evident in 2014. Overall capex started strong in 1H, then declined sharply in 2H with overall spending in Q4 coming in lower than in Q4 2013.
We expect the 2015e quarterly spending to resume a historical QtQ pattern with a modest start in Q1, a ramp up in Q2, a softening in Q3 and a strong finish in Q4, reaching what we expect will be the highest Q4 investment level in the past four years.
Though still early in the game, 2015e could shape up to be a pretty good year. Aggregate projected capital spending levels are off just -1% from the all-time high. As long as the wireless carriers are challenged to meet the ‘always on’ mobile data demand from their customers, they must continue to invest in their network expansion and modernization.